PISA tests are held once every three years. Each year of assessment focuses on one of these subjects, with the other two assessed but to a lesser extent. There have been five PISA surveys:
- PISA 2000 – reading
- PISA 2003 – mathematics
- PISA 2006 – natural sciences
- PISA 2009 – reading
- PISA 2012 – mathematics
- PISA 2015 - natural sciences
- PISA 2018 - reading
- PISA 2022 - mathematics
- PISA 2025 - science
A regularly conducted survey provides an opportunity to identify education trends worldwide.
Estonia has been participating in PISA surveys since 2006. Taking part in international surveys provides us with information about the functioning and results of our educational system compared to other countries. Regular participation helps us identify trends in educational outcomes as well as in background systems, which in turn allows us to propose necessary changes and improvement actions.
In most countries compulsory education ends after the child has turned 15 and the student proceeds to make personal choices regarding his/her path for further education. The sample of the survey includes students aged between15 years and 3 months to 16 years and 2 months.
The following is surveyed in PISA:
- How well-prepared young people are to face the challenges ahead
- Are the students capable of analysing, finding causes and presenting their own ideas
- How capable students are in applying their skills and knowledge in real life situations
The main goal of PISA tests is to assess students’ competences which enable them to be actively engaged in life after leaving school. PISA measures students’ capacity to apply their skills and knowledge in real-life personal, social and global contexts. The term “literacy” is used to emphasise the students’ application of their knowledge in everyday life. For example, the functional reading test assesses students’ ability to obtain and assess information, read diagrams, find associations in a text, interpret, draw conclusions, etc.
Students fill in test booklets containing questions about the main subject of assessment and other two subjects. These skills are assessed by using problem-solving tasks, which usually contain a text, diagram, table or graph, with the questions constructed so tasks that students have to undertake are as close as possible to those they might come across in the real world. The students have two hours to complete the test.
After completing the test, students fill in a questionnaire about their attitudes towards the subject, e.g. science or reading, and their background. Heads of school also complete a short questionnaire about the number of employees, attitudes of teachers, independence of the school and its teachers, resources, practices, policies, etc.
The sample is designed to be representative of the total student population – the proportion of boys and girls, urban and rural schools, schools with different languages of instruction, etc. Countries are given concrete guidelines about which schools and students can be excluded from the sample. The proportion of students that the sample must cover is also determined.
In order to ensure the accuracy of an international survey, it is very important that every participating country strictly adheres to sampling requirements. The participation rate must be at least 80% of the students and 85% of the schools selected into the sample. Rules allowed countries to exclude up to 5% of the target population. It is very important that countries follow the procedural rules; only this ensures the comparability of the results.
The numbers of schools and students participating in the PISA test
- In 2006, more than 400,000 students from 57 countries participated in the survey. Estonia’s sample included 4,865 students from 169 schools.
- In 2009, 65 countries and economic regions took part and the number of participating students was about 470,000. Estonia’s sample: 4,727 students from 175 schools (2,297 girls and 2,430 boys; 3,841 from Estonian-medium schools and 886 from Russian-medium schools). 138 schools included in the sample were Estonian-medium schools, 31 Russian-medium schools and 6 were schools with several languages of instruction.
- In 2012, about 510,000 students from 65 countries and economic regions participated in the test. Estonia’s sample: the total sample included 5,867 students from 206 schools of which 1,088 students only took the financial literacy test. The main part of the test was taken by 4,779 students: 2,409 girls and 2,370 boys, of them 3,784 Estonian-medium schools 995 from Russian-medium schools. 166 schools were Estonian-medium schools, 37 Russian-medium schools and 3 with two different languages of instruction.
- In 2015, more than half a million students from 72 countries and economic regions participated in the test. Estonia's sample: the total sample included 5587 students from 206 schools of which 2788 were girls and 2799 were boys. 78% of participants did the test in Estonian, while 22% in Russian.
- In 2019, around 600 000 students from 79 countries and economic regions participated in the test. Estonia's sample: the total sample included 5371 students from 231 schools of which 2651 were girls and 2665 were boys. 75% of participants did the test in Estonian, while 25% in Russian.
- In 2022, 81 countries and economic regions participated with 690,000 students. Estonian sample: the total sample included 6392 students from 196 schools, of which 3120 were girls and 3272 were boys. 77% of students took the test in Estonian and 23% in Russian.
In 2025, 760 000 students from 91 countries and economies participated in PISA 2025. Estonian sample: the total sample included 6,304 students from 204 schools.
Comparison of the results of the PISA tests in Estonia
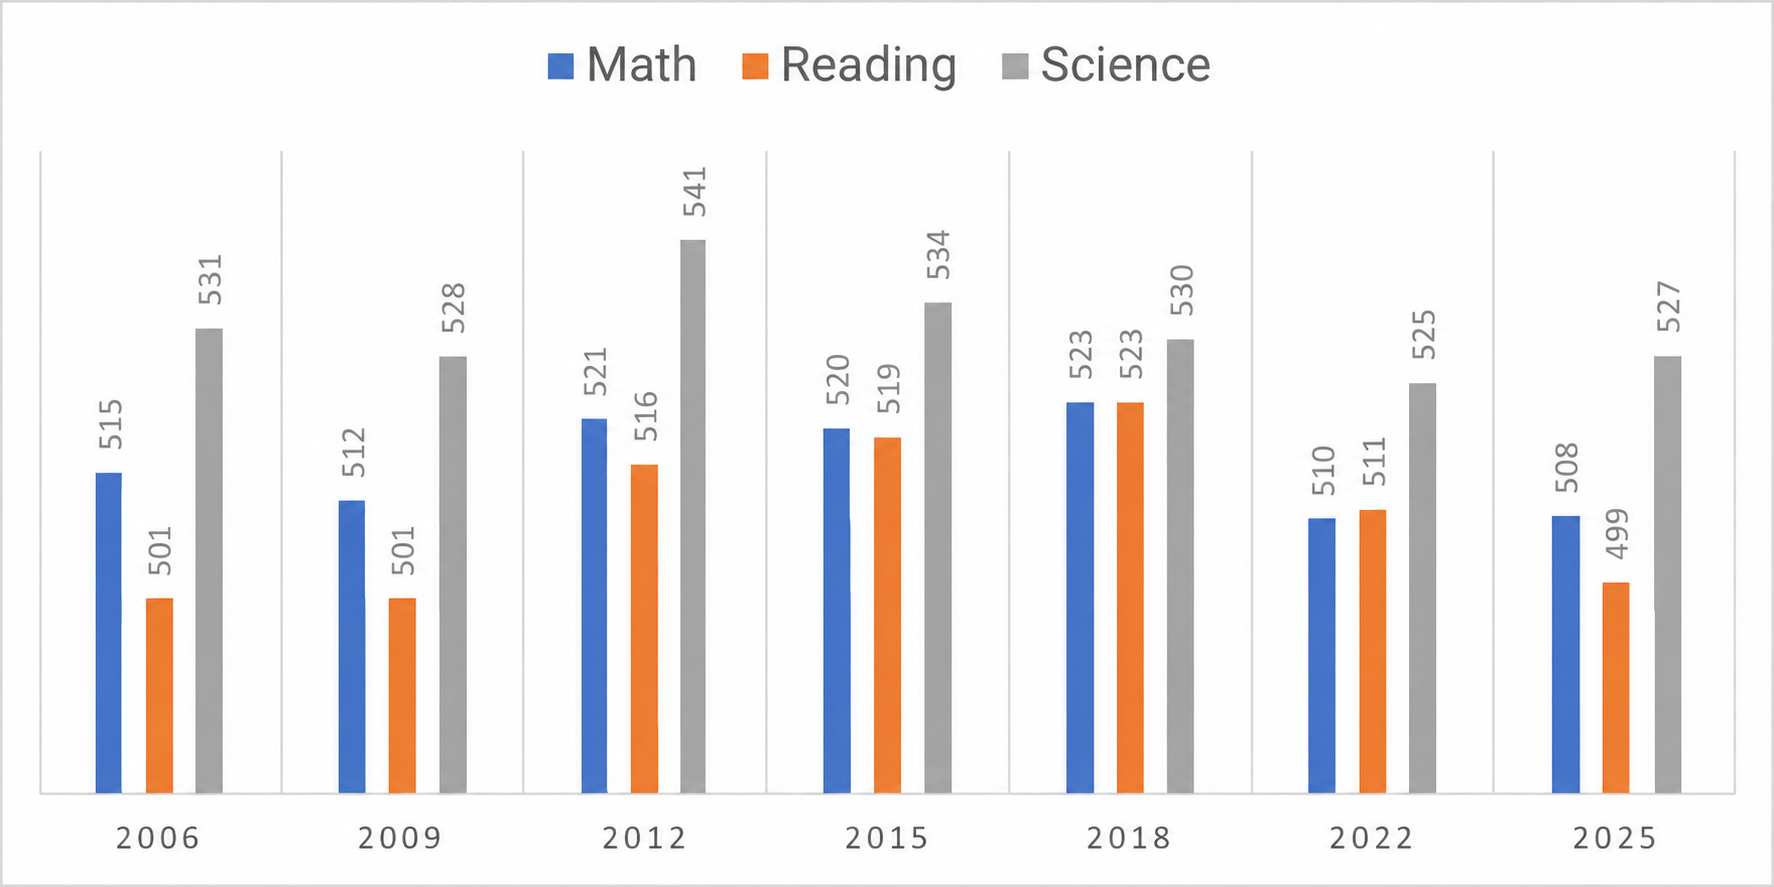
The graph shows the changes in all literacies in Estonian students average PISA test results of 2006, 2009, 2012, 2015, 2018, 2022 and 2025.
PISA 2025
In the spring of 2025, 15-year-old students took the PISA assessment, which consisted of tasks in science, reading, mathematics and computational problem solving. The main domain in PISA 2025 was science.
Estonian students continue to perform among the best in Europe and worldwide. In science, Estonia ranked 6th among all participating countries and education systems and 1st in Europe, with an average score of 527 points. The result remained unchanged compared with PISA 2022. In mathematics, Estonia ranked 1st in Europe with 508 points, while in reading Estonia ranked 2nd in Europe with 499 points. Estonia also ranked 1st in Europe in computational problem solving.
At the same time, the results show some longer-term challenges. Mathematics and reading performance in 2025 was significantly lower than in 2015 and 2018, and reading performance also declined compared with 2022.
In spring 2025, 6,304 students from 204 schools in Estonia took part in the PISA assessment. The sample represented around 14,600 15-year-old students in Estonia, or an estimated 89% of all 15-year-olds. Students and school principals also completed questionnaires that are used to analyse and interpret the results. Students from 91 countries and economies participated in PISA 2025..
- According to PISA 2025, the knowledge and skills of Estonian students remain among the best in the world and at the very top in Europe. Estonia ranks first in Europe in mathematics and science, second in reading and first in computational problem solving.
- According to PISA 2025, Estonia's result in mathematics is 508 points. Estonia ranks 1st in Europe, 3rd among OECD countries and 8th among all participating countries and economies.
- According to PISA 2025, Estonia's result in science is 527 points. Estonia ranks 6th among all participating countries and education systems, 1st–3rd among OECD countries and 1st in Europe. The result remained unchanged compared with 2022.
- According to PISA 2025, Estonia's result in reading is 499 points. Estonia ranks 8th among participating countries and economies and 2nd in Europe, after Ireland. The one-point difference between Estonia and Ireland is not statistically significant.
Strengths of Estonian education
- Estonian students continue to rank among the best in the world and at the top in Europe. Estonia ranks first in Europe in science and mathematics, second in reading and first in computational problem solving. Estonia also has a high share of students who reach at least baseline proficiency and a comparatively high share of top performers.
- Estonian students have a strong growth mindset and believe in their ability to succeed. 83% of students believe that their abilities can be developed through effort, practice and feedback, compared with an OECD average of 69%. This is the highest share among participating countries and economies. In addition, 72% of students believe that, regardless of their background, they can get ahead in life and improve their social position.
Estonia has a relatively equitable education system. The impact of students’ socio-economic background on their results is smaller than the OECD average. In science, the performance gap between socio-economically advantaged and disadvantaged students was 68 points in Estonia, compared with 86 points on average across OECD countries.
- Students in Estonia report relatively high life satisfaction and strong family support. Average life satisfaction increased from 7.1 in 2022 to 7.4 in 2025, above the OECD average of 7.2. Family support has also remained strong: 74% of parents asked their child about what they had done at school at least once a week and 63% discussed problems at school with them.
- Estonian students show strong digital awareness. 73% of students reported that they had been taught at school how to evaluate content generated by artificial intelligence, compared with an OECD average of 63%. In addition, 58% used AI chatbots to support their learning at least once a week.
- Estonian students have strong environmental science competencies. 89% of students reached baseline proficiency in environmental science, compared with 74% on average across OECD countries.
Challenges in Estonian education
- Halting the decline in learning outcomes. Performance in mathematics and reading in 2025 was significantly lower than in 2015 and 2018, while reading performance also declined compared with 2022. Since 2015, the share of students performing below Level 2 has increased by six percentage points in both mathematics and reading.
- A concerning trend is the weakening of skills that are particularly important in the age of artificial intelligence: critically evaluating information, integrating information from different sources and making sense of what is read. Between 2018 and 2025, the share of students who read hastily and give quick but incorrect answers almost doubled.
- Reducing gender gaps in reading and mathematics. Girls outperformed boys in reading by 25 points, while boys outperformed girls in mathematics by 13 points.
- Reducing the impact of students’ socio-economic status. Although Estonia remains a relatively equitable education system and the relationship between socio-economic status and performance has weakened, it has not returned to its 2015 level in all assessment domains.
- Reducing differences between Estonian- and Russian-language schools. Students in Estonian-language schools continue to outperform students in Russian-language schools. The gap was 40 points in science, 32 points in mathematics and 31 points in reading.
- Improving the school climate. 27% of students in Estonia reported being bullied at least a few times a month, compared with 20% on average across OECD countries. Students’ sense of belonging at school and perceived teacher support also remained below the OECD average.
- Ensuring sufficient teaching and support staff. According to school principals, 65% of students attended schools where a shortage of teaching staff hindered instruction at least to some extent, compared with 39% on average across OECD countries.
- Developing students’ self-directed learning skills. Only around 43% of students often or very often planned how they would learn, while 46% regularly checked their understanding by asking themselves questions.
- Reducing digital distraction. 36% of students reported being frequently distracted by digital devices in science lessons, compared with an OECD average of 28%. Students in Estonia also spent more time using digital devices for leisure than the international average.
PISA results
PISA and Estonia: international media
Last updated: 11.09.2026